

Dr Dirk J. Booysen
SAOA August 2018
Definition
- Myopia is an abnormal condition breaking the emmetropisation process (Flintcroft., 2013)
- Myopia is a spherical equivalence (with cycloplegia) of > -0.50D (Curtin., 1985, Khurana et al., 1988, Manny et al., 2001)
- High myopia is defined as a refraction of > -6.00D (Holden et al., 2016, Morgan et al., 2012)
- Myopia is an axial length >24mm and high myopia >26mm (Meng et al., 2011, Percival., 1987)
- Myopia is the increase in axial length and the thinning of the sclera that may be due to both reduced collagen synthesis and increased collagen degradation caused by form deprivation, minus lens rearing, and peripheral hyperopic defocus (McBrien., 2003 & 2013)
- Myopia is an ocular disease characterized by an abnormally elongated eyeball, which cannot be rescued by optical lenses or refractive surgeries (Wu et al., 2016)
Classification
- Pathological, Physiological, Intermediate
- By degree, low (< -3D), Moderate (3 -6D), High (> -6D), Very high (> -10D) – with or without cycloplegia?
- Anomalous myopias: Pseudomyopia (NITM)*, night myopia, instrument myopia
- Syndromic myopias: high myopia < 10 years
* NITM = Near work induced transient myopia
Classification (Grosvenor 1987)
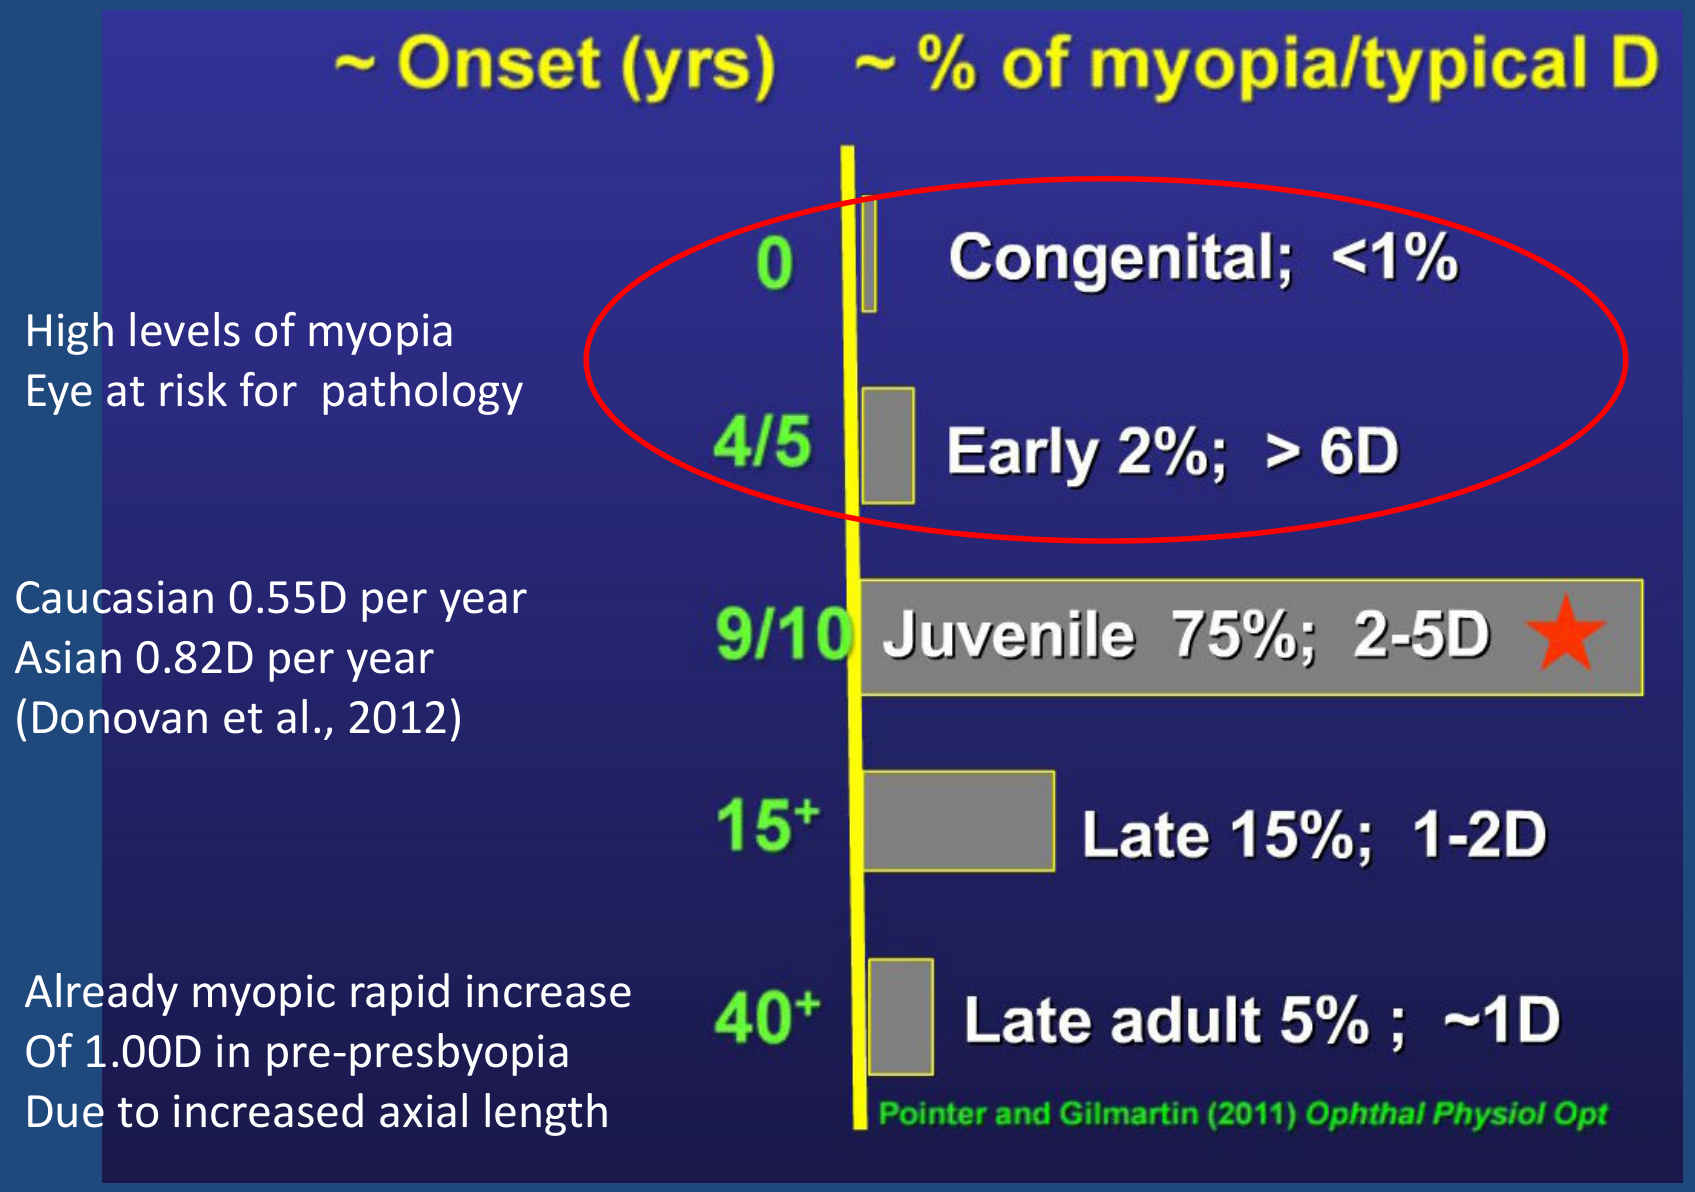
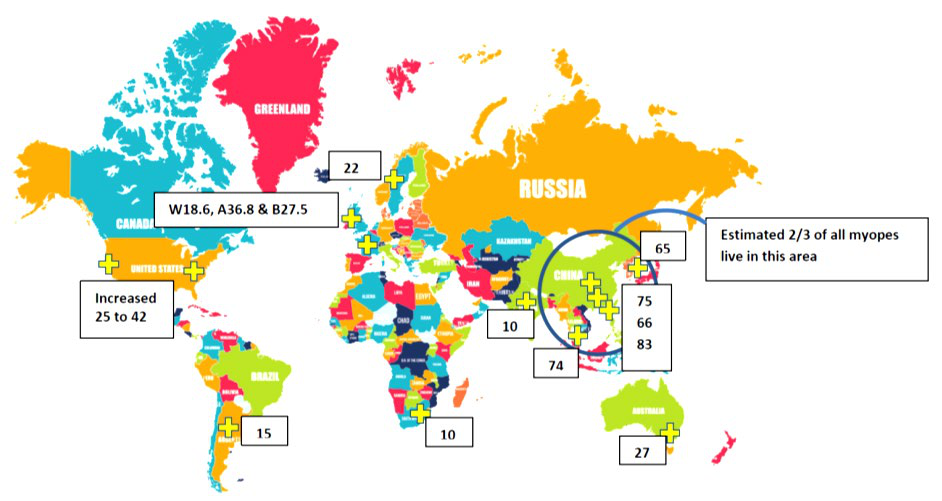
World-wide % prevalence of myopia ~ 15+ years, urban population, cycloplegic refraction (Morgan and Rose, 2005)
17 -19 yrs – Korea 96.5% (Jung et al., 2012), Beijing 74% (You et al., 2014), Rural China 5% (Li et al., 2014), New Delhi 10.8% (Murthy et al., 2002)
| Country | 5 – 10 years | 11 – 15 years | 16 -18 years |
|---|---|---|---|
| Taiwan | 7yrs – 5.8 to 21% | 12yrs – 36.7 to 61% 15yrs – 64.2 to 81% | 74% |
| Singapore | <6yrs – 11% 7yrs – 29% 8yrs – 34.7% 9yrs – 53.1% | ||
| Hong Kong | <7yrs – 17% 8yrs – 37.5% | >11yrs – 53.1% | |
| Korea | 50% | 12 – 18yrs – 78% | |
| China | Urban 5.7 to 30.1% Rural <5yrs – <1% | Urban 78.4% Rural 13yrs – 36.8% 15yrs -43% | Rural 53.9% |
| India | Urban 5yrs – 4.7% 10yrs – 7% Rural 5yrs – 2.8% 10yrs – 4.1% | Urban 15yrs – 10.8% Rural 15yrs – 6.7% | |
| Nepal | Urban 10yrs – 10.9% Rural 5 – 15yrs – 1.2% | Urban 12yrs – 16.5% 15yrs – 27.3% |
Non-Asian Countries
| Country | 7 – 10 years | 11 – 15 years |
|---|---|---|
| Australia • White European • Middle East Asian • East Asian • South Asian | 6yrs – 1.4% | 12yrs – 11.9% 12yrs – 4.6% 12yrs – 6.1% 12yrs – 39.5% 12yrs – 31.5% |
| USA • White European • Asians • Hispanics • African | 6-7yrs – 4.5% | 12yrs – 28% 5-17yrs – 4.4% 5-17yrs – 18.5% 5-17yrs – 13.2% 5-17yrs – 6.6% |
| Chile | 5yrs – 3.4% | 15yrs – 14.7 to 19.4% |
| England | 6-7yrs – 2.8% | 12 – 13yrs – 17.7% |
| Sweden | 12-13yrs – 49.7% | |
| Greece | 10-15yrs – 37.2% | |
| Bulgaria | 10-15yrs – 13.5% | |
| South Africa | 5-13yrs – 3 to 4% | 14yrs – 6.3% 15yrs – 9.6% |
What does the future hold?
- By 2050 half the global population – 5 billion people – will be myopic
- One fifth of these people – 1 billion – will be highly myopic and at risk for increased ocular and retinal disease
Holden et al., 2016
Why should we be concerned
- Myopia represents a significant risk factor for the development of ocular pathology – if nothing is done myopia will become a major cause of blindness around the world (Holden et al., 2014)
- Temporal crescents (all eyes over 28mm AL )
- Chorioretinal atrophy
- CNV – lacquer cracks leads to severe vision loss in 0.1 – 0.5% of myopic patients in Europe and 0.2 – 1.4% in Asia (Wong et al., 2014)
- Myopic macular degeneration (8x greater risk) and Foster-Fuchs spots (Tano, 2008)
- Posterior staphyloma, 20% of eyes longer than 26.5mm (Gohil et al., 2015)
- PVD and RRD (50% of all RD occur in myopes, increased risk in cataract surgery) (Lam et al., 2016)
- Lattice degeneration
- Early onset cataracts (3x greater risk)
- Glaucoma (18x greater risk), Odds ratio of 3:1 for <-5.00 and 1:3 for low myopia (-0.25 to – 5D) (Tano, 2008)
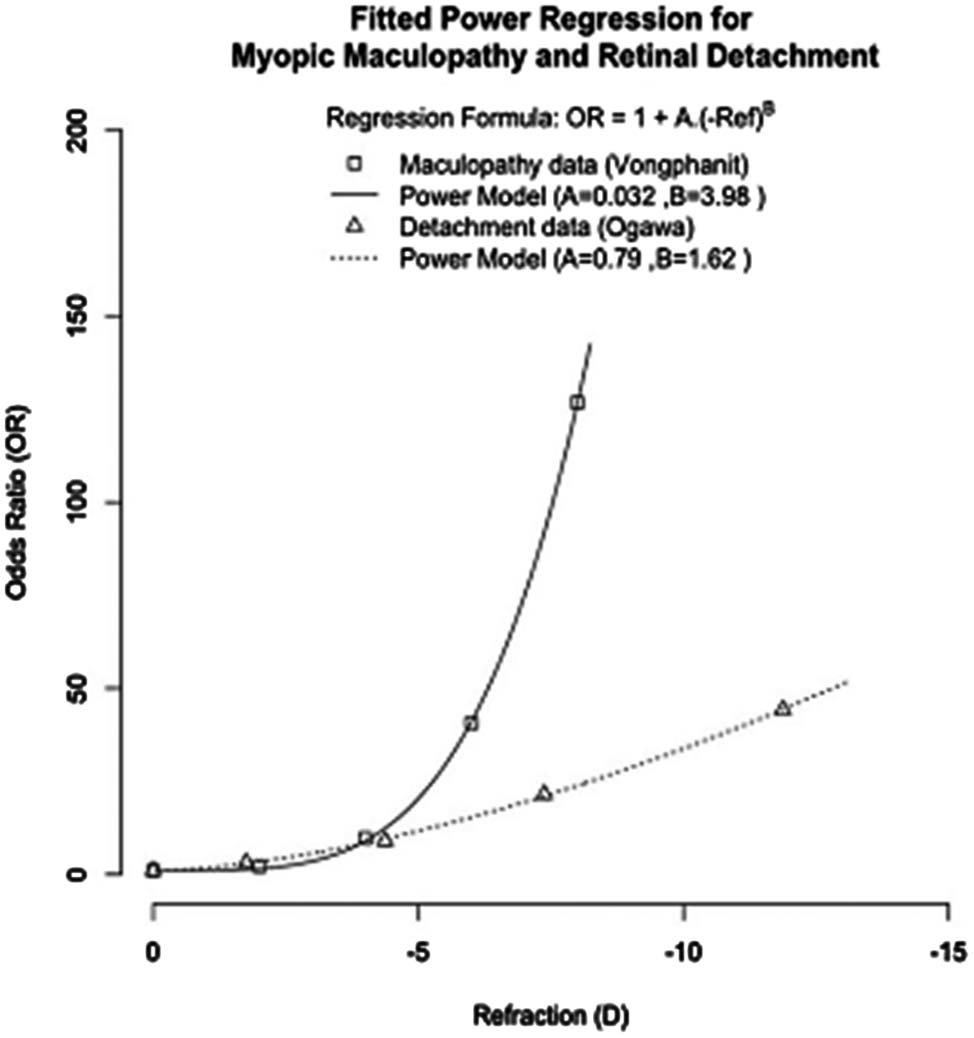
Flitcroft DI, 2012
- The risk of retinal detachment and macular degeneration increases logarithmically with the increase of acquired myopia
- The risk begins with as little as 1.00 D of myopia.
Is juvenile (school) myopia genetic or caused by environmental factors?
Nature (Heredity) vs. Nurture (Environment)
- GEM* study clearly identify a genetic component to refraction and its ocular biometric components through analysis of both twins and families
- Axial length appears to be the most heritable trait with the least amount of environmental influence
- Modifiable environment risk factors such as education associated with refractive error also have a genetic component
*GEM – Genes in myopia study
Baird P N, Schache M, Dirani M, Progress in retinal research 2010
Nature vs. nurture
- Children of myopic parents become myopic – therefore school myopia must be genetic?– myopigenic environments?
- Prevalence associated with ethnicity or educational attainment represent cases of simple environmental effects, rather than cases of genetic determination or gene environment interactions (Logan and Rudnicka,2010)
- School myopia is predominantly a disorder caused by abnormal environmental exposures that promote axial elongation that cannot be overcome by emmetropization (Morgan and Rose, 2010)
Summary
- Complex quantitative traits such as myopia are often controlled by dozens or even hundreds of chromosomal loci, the identified chromosomal loci could account for less than 25% of myopia cases (Farbrother et al., 2004)
- Holistically urbanization of modern society creates a myopigenic environment which promotes the development and progression of myopia
- This myopigenic environment affects what we eat, how much time we spend doing near work tasks, our outdoor activity, our genetics through gene expressions and their mutations, and a host of other factors.
New definition
- Myopia is a polygenic multifactorial disease governed by both genetic and environmental factors (Baird et al., 2010).
How can we predict myopia onset and progression?
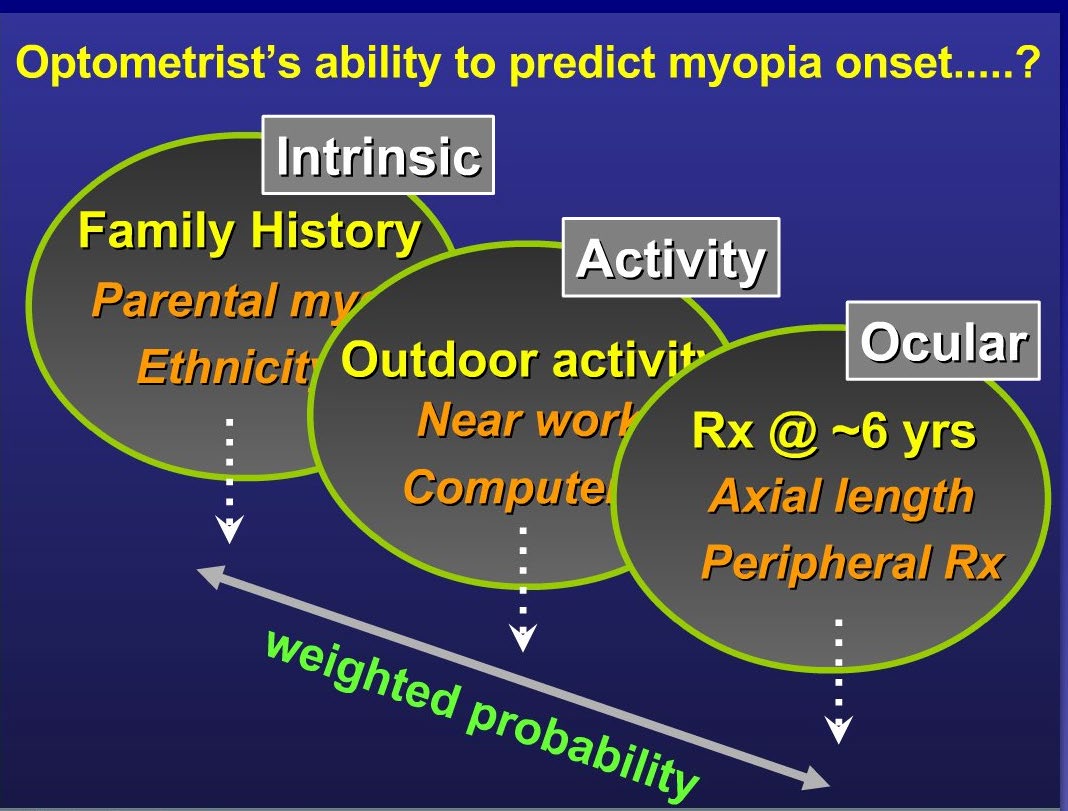
Intrinsic factors
- Pacella et al. 1999
Children with two myopic parents were 6.42 x more likely to be myopic than children with no myopic parents
- Mutti et al. 2002
Odds ratio 3.31 for myopia onset given one myopic parent and 7.29 for myopia onset given two myopic parents
Activity
- Jones-Jordan et al. 2011
- Outdoor activity was significantly different between subject who became myopic and emmetropes, difference present up to 4 years before myopia onset
- Near work hours significantly greater in those that became myopic 1 year before onset
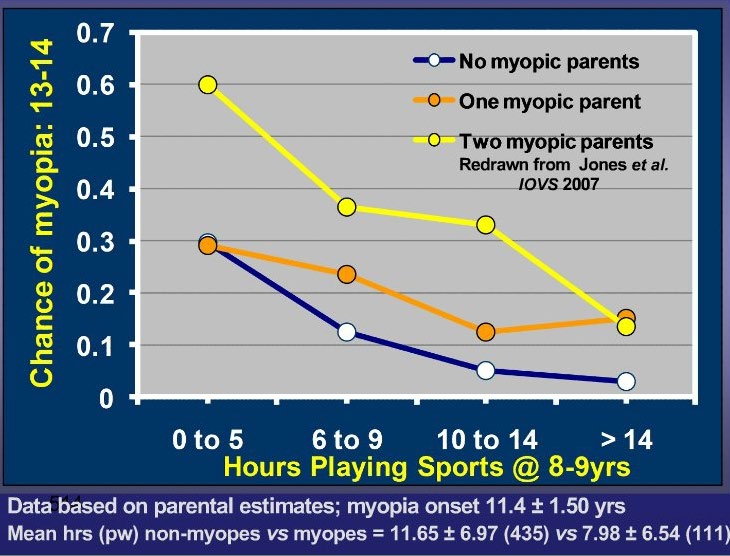
- Jones et al. 2007
- Greater the outdoor activity at 8/9 yrs the lower the risk of myopia at 13/14 yrs
- Reading activity marginally significant & outdoor activity not correlated with amount of reading
- Significant interaction between parental myopia and protective effect of outdoor activity
Non myopes spend approximately 33% more time outdoors (30minutes per day) than myopes
Why is outdoor activity beneficial?
- Vitamin D – myopes have lower levels of vitamin D than emmetropes (Mutti & Marks, 2011)
- Higher light intensity, smaller pupils, larger depth of focus, less image blur – less myopia progression (Dharani et al., 2012)
Outdoor activity and blue light
- Release of dopamine in the retina due to blue light exposure (460-500 nm) prevents axial length increase (McCarthy et al., 2007)
- Not enough exposure to sunlight (including blue light) in children could affect the growth and development of their vision and increase the risk of short-sightedness in teens and young adults (Booysen, 2018)
- “20-20-20” rule – Every 20 min, look at object 20 feet away for 20 seconds
Ocular factors – Refractive error
- Zadnick et al. 1999
MSE ≤ +0.75D at age 8/9 yrs. Sensitivity 86.7% and specificity 73.3% for predicting myopia at age 14 yrs
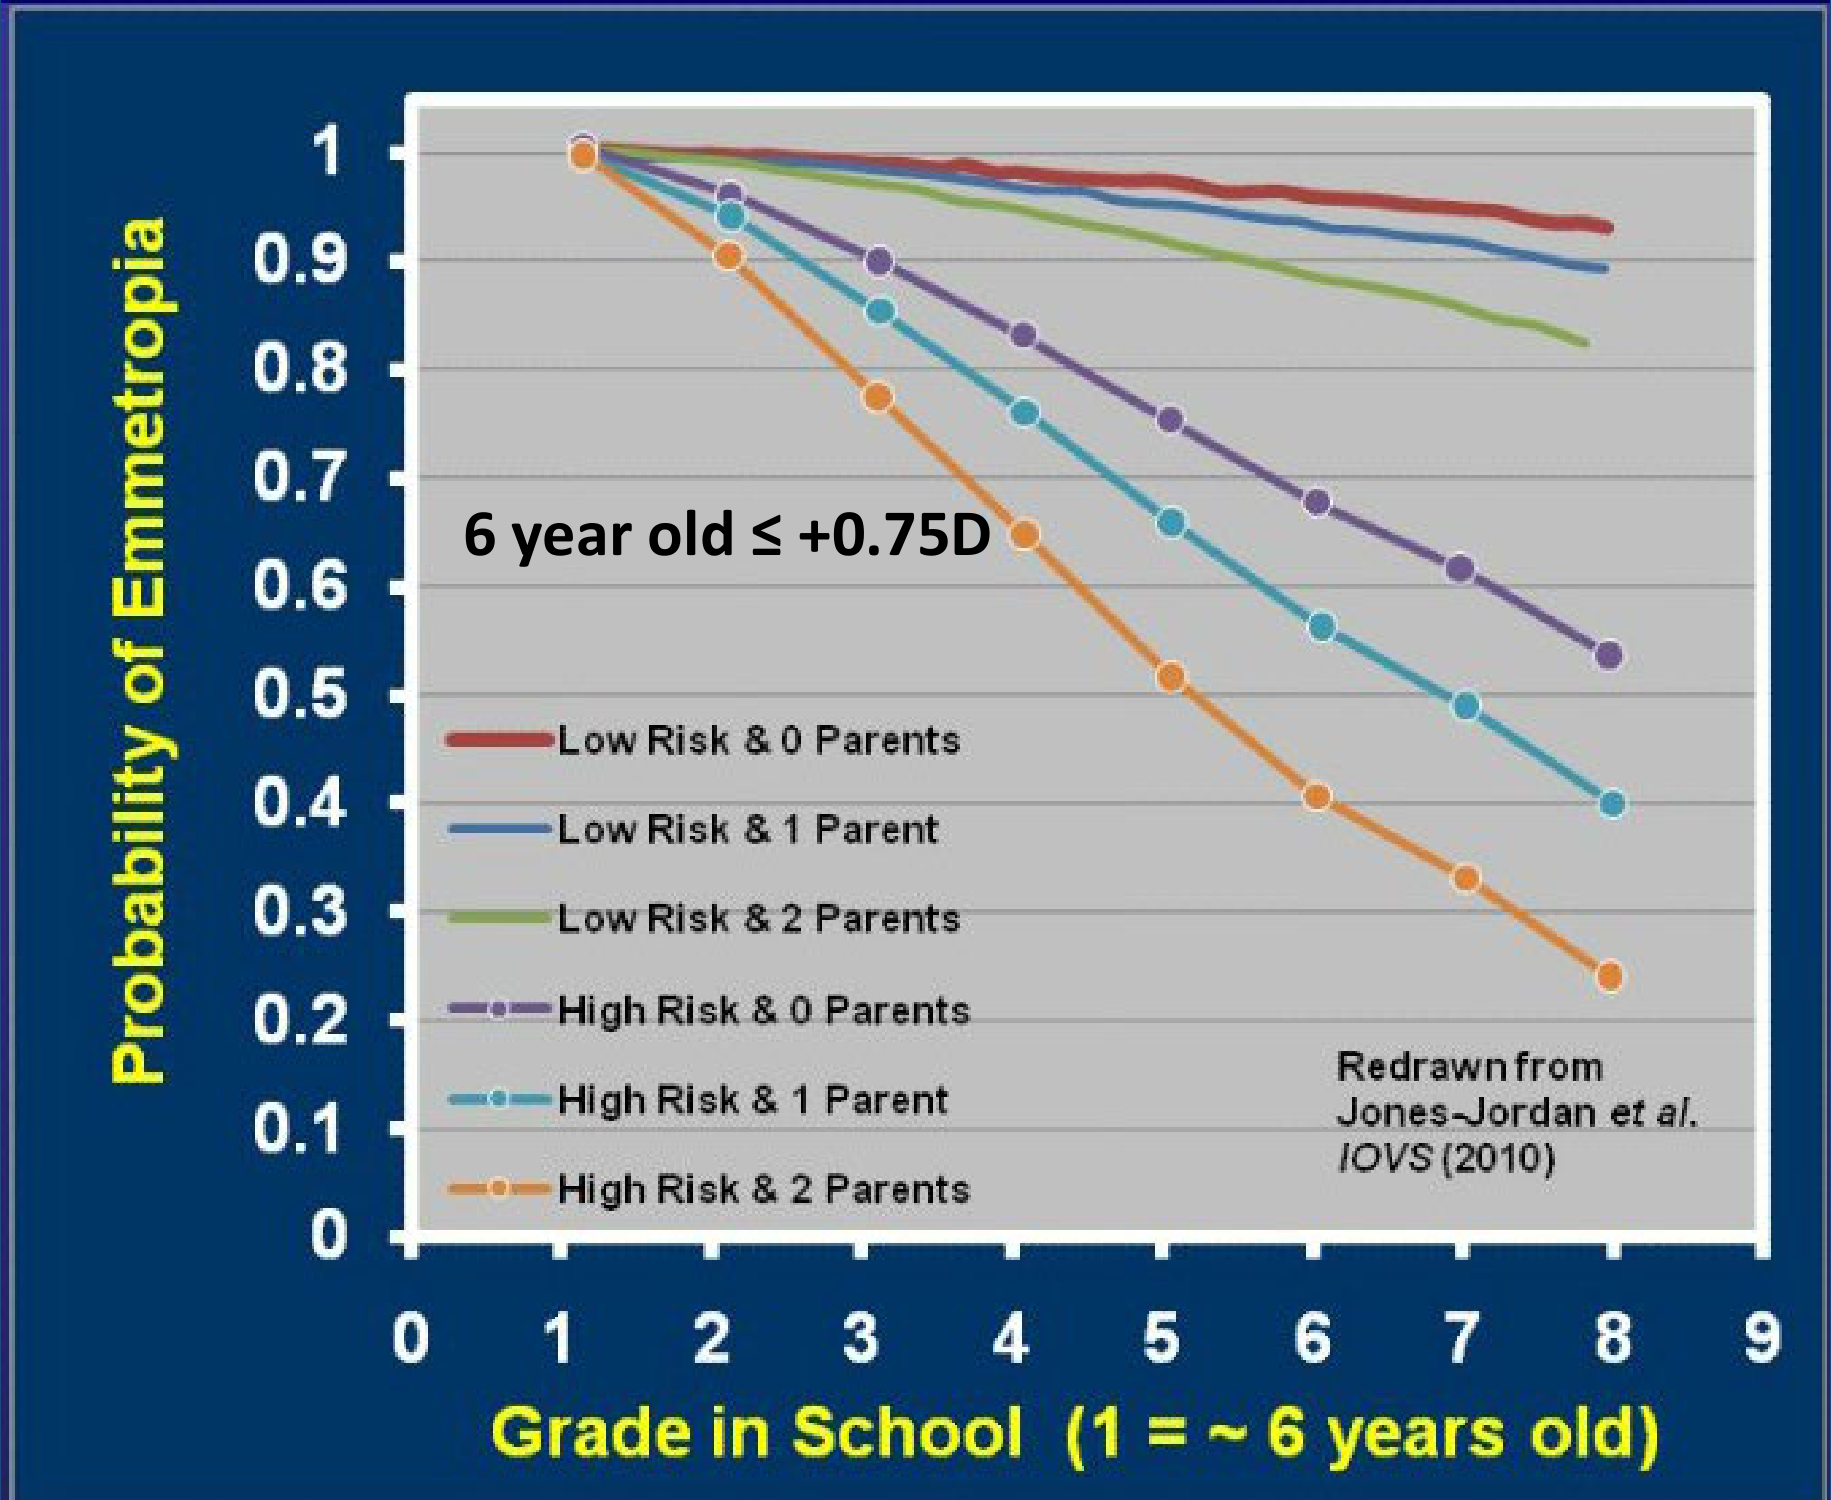
- Jones-Jordan et al. 2010
Considered high risk if cycloplegic MSE ≤ +0.75D at age 6 yrs. Combined with parental history, sensitivity of 62.5% and specificity of 81.9% for predicting myopia at age 14 yrs
Ocular factors
- Mutti et al. 2007
Myopic eyes clearly different from emmetropic eyes before the onset of myopia
- Less hyperopic 4 years before onset
- Had longer axial length 3 years before onset
- More hyperopic peripheral refractive error 2 years before onset
Fastest interval for change in all three components was in the year before onset
Fastest rate of change in year prior and year after onset
What drives the excessive ocular growth in myopia?
Deprivation (Hubel & Wiesel 1981)
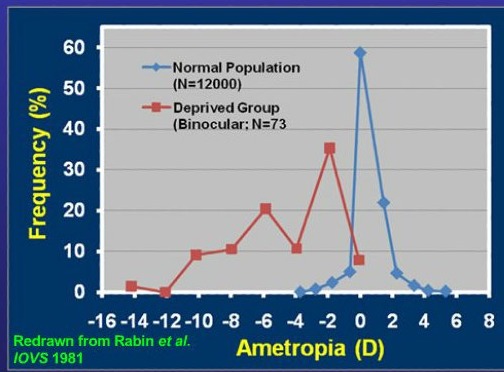
| Group | N | Ametropia (D mean ± sd) |
|---|---|---|
| General Pop. | 12000 | +0.54 ±1.13 |
| Retrolental fibroplasia | 32 | -5.66 ±3.49 |
| Optic atophy | 8 | -3.70 ±3.53 |
| Macular dystrophy | 13 | -2.14 ±2.59 |
| Congenital cataract (phakic) | 14 | -5.89 ±3.61 |
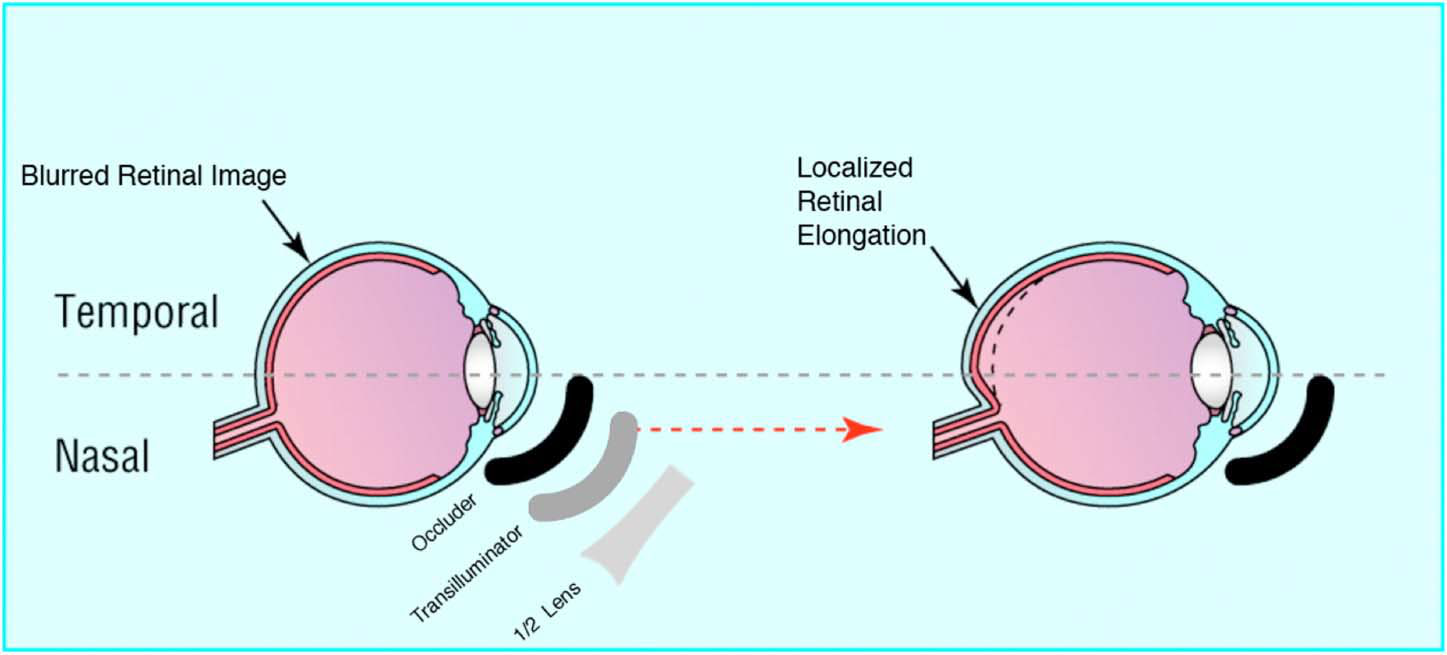
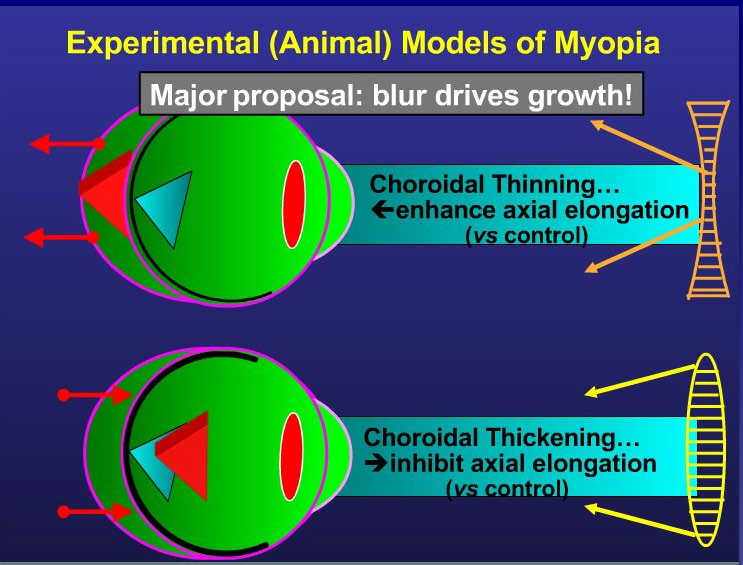
- Regional blur causes axial elongation
- Regional retinal blur created in half the retina causes regional elongation of the eye
- This occurs even when the optic nerve is cut, but will not occur if atropine is injected into the eye
- The eye recognizes the direction of the blur, that is, plus or minus lenses and the region of retinal blur
(Cooper J, Schulman E, Jamal N. Current status on the development and treatment of myopia. Optometry 2012;83:179–99)
Nobel prize in Physiology/medicine 1981
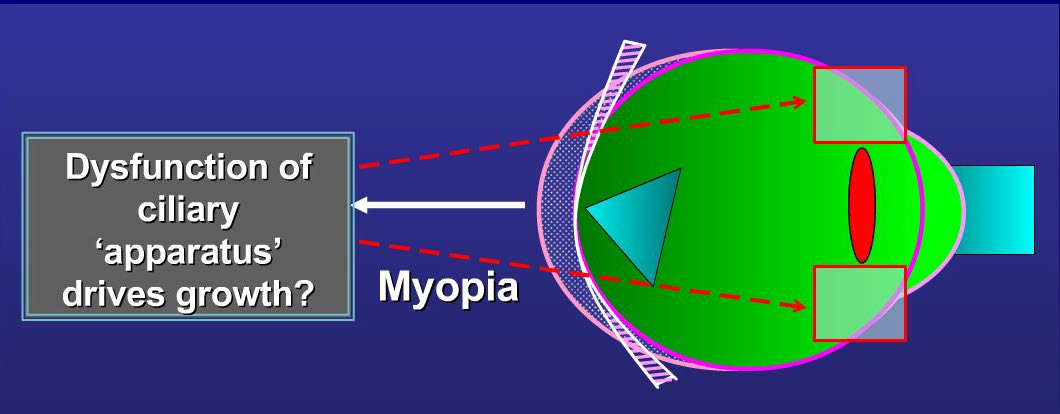
A decrease in accommodation accuracy and an increase in accommodative lag associated with a deficit in the ciliary apparatus is likely to produce central hyperopic defocus either directly or indirectly by altering embedded synergistic link with the oculomotor system e.g. altered AC/A ratios, CA/C ratios or fusional reserves (Mutti et al., 2006)
Earl Smith probably asked the most important question regarding growth?
Does the eye respond to foveal blur, peripheral blur, or equally to both?
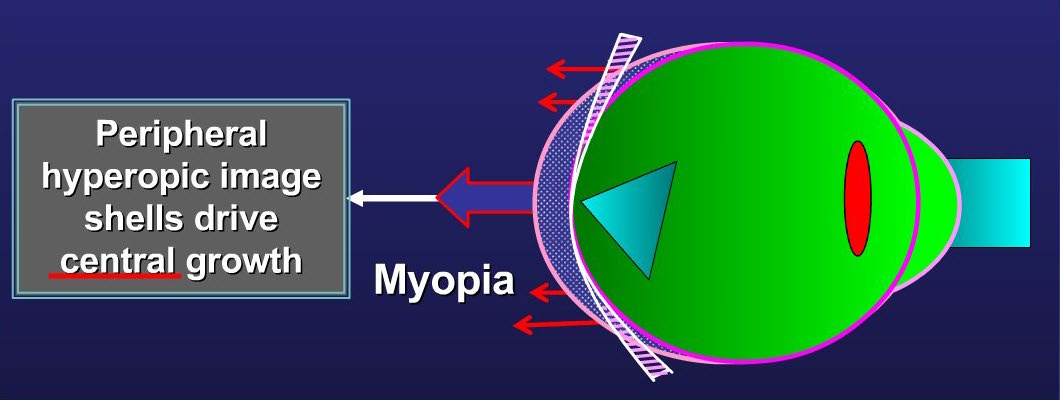
Smith et al. IOVS (2005) Hyperopic blur drives growth
Smith et al. IOVS (2007), Huang et al IOVS (2009) Peripheral retina can independently drive central growth
Smith et al. Vis Res (2009) Hyperopic image shells drive growth
Smith . IOVS (2011) Peripheral hyperopia often precedes the onset of central myopia and can be a risk factor for the onset and progression of myopia.
Conclusion
- Emmetropisation is a ‘vision-dependent’ phenomenon
- Defocus information is summed up across the entire surface of the retina and the integrated signal regulates the growth of the eye
Finally
- The quality of the retinal image is a primary aetiological candidate for the onset and development of myopia
- This is of particular importance as optical methods of myopia control are currently likely to be the most appropriate methods for use in general clinical practice